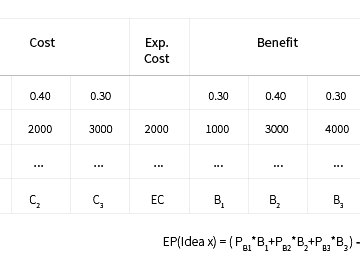
The cost-benefit table considers the (monetary) costs of a certain alternative and their probabilities. In the given example, there is a 30% chance idea 1 will cost 1000, a 40% change it will cost 2000 and a 30% chance it will cost 3000. This results in an expected pay-off of (0.30*1000+0.40*3000_0.30*4000)-(0.30*1000+0.40*2000+0.30*3000) = 700. To use this […]
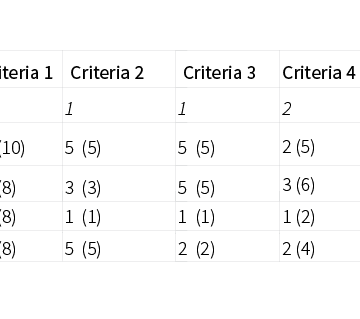
The Decision Matrix is a technique making use of alternatives, criteria and possible criteria weights. Criteria weights can be determined by intuition and paired comparison. You can also execute this matrix without weighted criteria. If you are using weights, you can decide to distribute a limited number of points over the criteria or compare criteria pairwise.

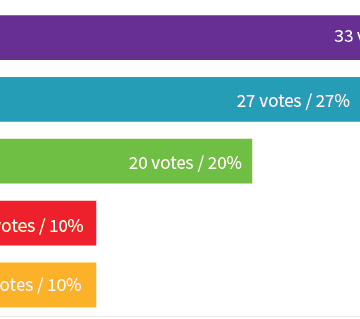
Voting is a group technique were team-members can cast one or a limited number of votes on certain alternatives or ideas. A popular (online) form of visualizing voting is using polls.

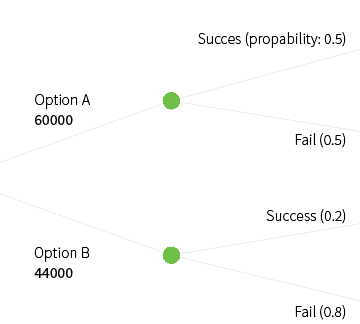
The decision tree is related to the cost-benefit table, but incorporates a different way of visualizing possible outcomes of a certain option, decision or alternative and the probabilities of these outcomes. The figure just above gives an example of two different options, with each a different probability for a certain payout.

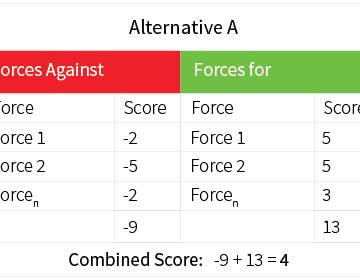
The force field analysis lists forces against and forces for a certain alternative and sums their scores. You could also exchange forces against and forces for with disadvantages and advantages of a certain alternative. In a group setting, a force field analysis can also uncover who are resisting or assisting a certain alternative and in that […]