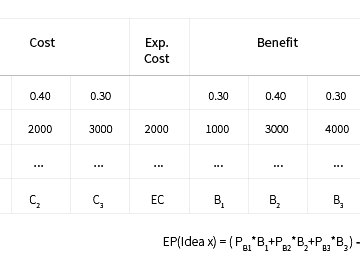
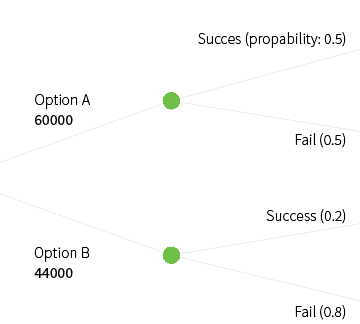
The cost-benefit table considers the (monetary) costs of a certain alternative and their probabilities. In the given example, there is a 30% chance idea 1 will cost 1000, a 40% change it will cost 2000 and a 30% chance it will cost 3000. This results in an expected pay-off of (0.30*1000+0.40*3000_0.30*4000)-(0.30*1000+0.40*2000+0.30*3000) = 700. To use this […]


