

Empathy Map Introduction
The Empathy Map is a simple, visual and effective method developed by XPLANE. It is a visualization tool that helps you to relate to different types of users and their experiences. In addition, it provides insight into their pain points (pain) and needs (gain).
The challenge of this tool is to better understand user needs and recognize those pain points and benefits for people. So that products, services and value propositions can be improved. This allows you to find better ways to reach users and build effective customer relationships.

The Empathy Map serves as a collective folder of all information gained from qualitative research, customer personas, interviews and surveys. All this information can be clearly displayed on one page. The card thus helps to sketch a user profile or persona. It’s an easy way to shape user behaviour. The Empathy Map can also be used by decision-makers, assisting them in crucial assessment processes.
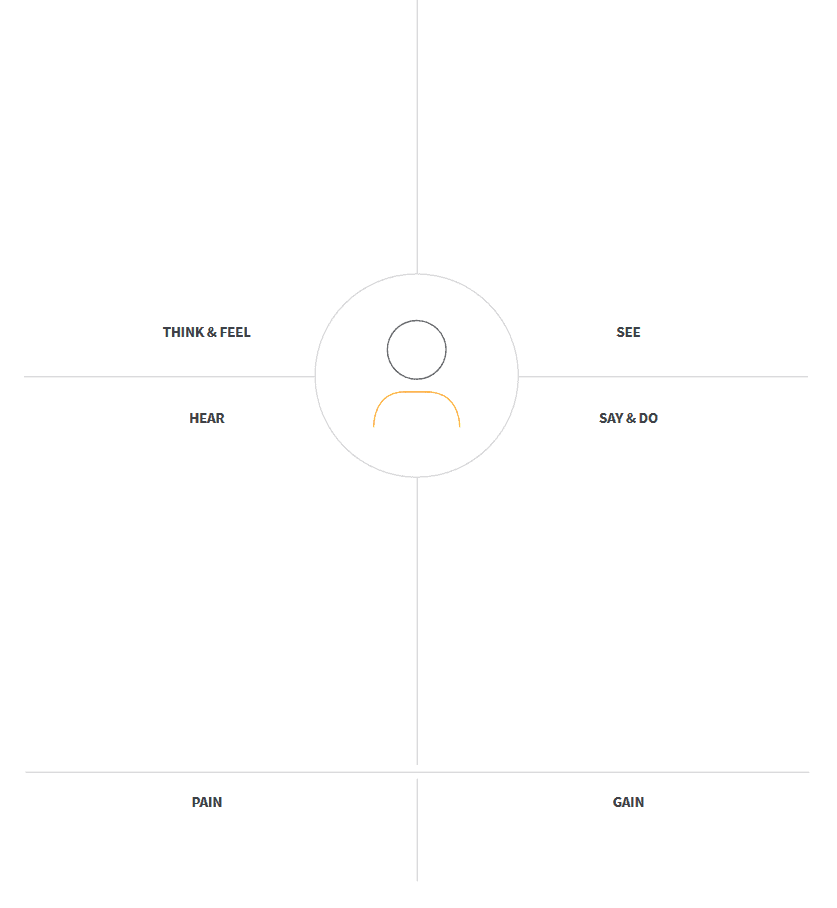
The Empathy Map is divided into 4 parts, in what someone sees, thinks & feels, hears, says & does. Filling in the card is done on the basis of 6 questions.
Empathy Map Example
Template
Download Template
Empathy MapOnline Templates
Executing the Method
-
Step 1: Collect information beforehand
Various research data is required to complete the Empathy Map. Collect this research data through qualitative research such as in-depth interviews.
-
Step 2: Select Personas
Select 1 to 3 personas to fill out the Empathy Map. Collect all relevant information from the personas and print this out.
-
Step 3: Create the Empathy Map
Print the template or draw a 4 coordinate system containing the 4 elements: see, think & feel, hear, say & do. Place the persona in the middle, use a photo, name or description. The pains and gains will be placed at the bottom.
-
Step 4: Complete the Empathy Map
The group immerses itself fully in the persona. Write down the most valuable research data per element on post-its and place it next to the correct element, including the pains and gains. Use the "questions parts" from the template.
-
Step 5: Criticize
View the completed Empathy Map and criticize each element by asking the questions per section again. Also ask each other questions such as; what insights are revealed? Which data is missing? What more needs to be investigated?
Necessities
Empathy Map Components
Advantages & Disadvantages
-
When collecting and selecting research data, the group may experience bias, as a result of which reality is not properly reflected and the personas lose their added value.